
Illustration - Removing Errors and Bias
In traditional scoring, judges use their own point scales, which can create errors and unfair influence on competition outcomes. NSS fixes this by:
-
Standardizing each judge’s scores so they’re all on the same scale
-
Normalizing ranking differences so no single judge’s wider or narrower scoring range can dominate results
-
Reducing error and bias so results better reflect the consensus ranking of competitors
Instead of relying solely on raw points, NSS focuses on relative performance across judges — which means if everyone agrees who should win, NSS preserves that outcome even if judges score differently.
As you can see below in the “BEFORE NSS” graphic, Judge 3 has effectively controlled the outcome of the contest by using a large point spread (we call this “point spread bias”).
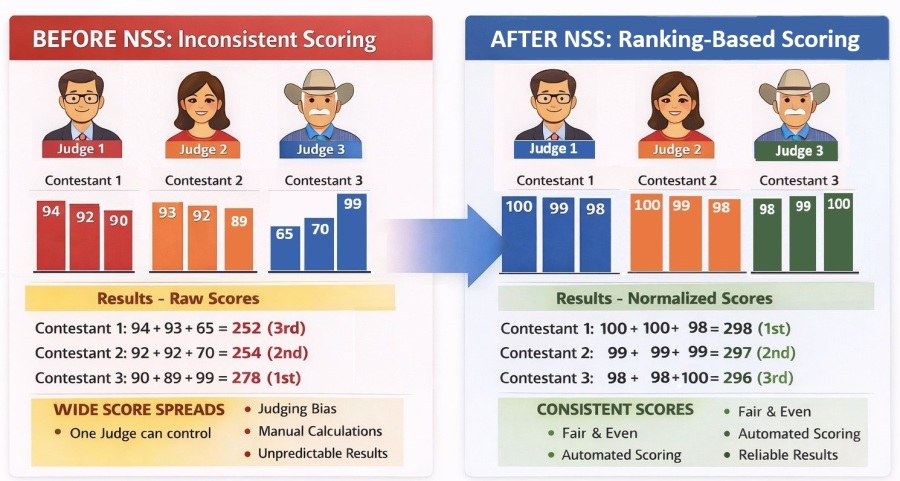
Now you can see below in the “AFTER NSS” graphic, all scores have been forced to be on the same scale of point spread. EACH judge has the exact same effect in the results. Two of three Judges had Contestant 1 in 1st, they all had Contestant 2 in 2nd and Contestant 3 ended up in 3rd - where two judges had them. The error in judgement of Judge 3 has been effectively eliminated.
Want the Full Explanation?
For a detailed description how the NSS removes errors and bias, with examples and comparisons to traditional scoring, you can download a detailed explanation.